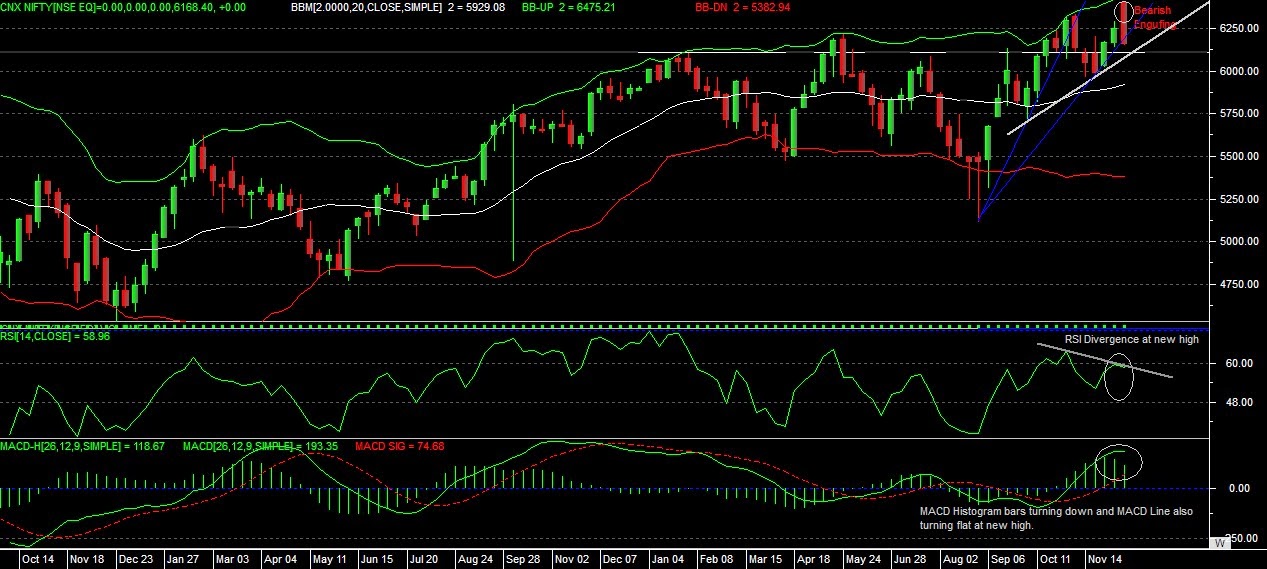
There is a Bearish Engulfing Pattern made on Nifty Weekly Chart.
RSI is also showing Divergence at the New High.
MACD line also turns flat at New High.
Nifty is having support at 5972.
There was sharp decline after Bearish Engulfing made on 20-05-13.
Decline halt on 20-06-13 for few weeks, and started trading in a range.
Consolidation takes place in the middle of the downtrend.
Consolidation completes between 3- 4 weeks.
The Second Rally in the Consolidation phase , fails to touch the previous high & reaction sets in.
On 16-07-13, the long Black candle sifts through the lower trend line and closed beyond it, furthermore next day, a long black candle is formed which take the move down by more than 2% , which confirms the true breakdown from the Flag pattern.
A Pull back came in for 3-4 days after break down from the lower parallel flag line
A shooting star pattern develops at the last day of pullback, & thus next day a gap down opening took the move further in the continued downtrend.