.png)

Wednesday, December 17, 2014
Tuesday, December 16, 2014
.png)
.png)
.png)
Friday, December 12, 2014
Weekly review of Tata Steel Ltd : Fibonacci retracement, extensions, patterns.
- Tata Steel fell about 14.3% in this week, breaking major support near 433-435 levels.
- This support is broken via long black bearish candle with no shadows on the either side, indicators, bears had full control over bulls.
- Price trend along the down-sloping trendline.
- Horizontal support trendline is broken.
- Prices closed under 200 week sma, indicating intermediate term weakness.
- Stock was respecting previous top resistance turned as support at 433-435 from the past two months.
- Stock showed a bounce -off this support area & retraced 38.2% of its previous down fall from 581-435.
- And found difficulty crossing this 38.2% ( 495) retracement resistance.
- Stock then traded in a narrow range ( 495- 485, 485- 458.) for about 5 weeks.
- Finally in this week , we had seen a breakdown from this trading range.
.png "Weekly Chart") |
.png)
.png)
.png)
Tuesday, December 9, 2014
20141209155149.png)
20141209152434.png)
20141209152718.png)
20141209154147.png)
20141209152052.png)
Monday, December 8, 2014
Idea Cellular Daily Chart as on 28th Nov & 8th December 2014.
Daily Chart as on 28th November 2014
.png) |
| Daily Chart as on 28th November 2014 |
Daily Chart as on 8th December 2014
.png) |
| Daily Chart as on 8th December 2014 |
Sunday, December 7, 2014
Review of Tata Steel Charts
.png) |
| Monthly Chart |
We had seen a Head & Shoulder Bottom reversal pattern & the breakout therefrom, on the monthly charts of Tata Steel.
And a pullback to the neckline (Level of 434 ) of H & S Pattern is also seen .
Stock managed to bounce -off from the neckline , faced difficulty to cross 490-495 levels.
It slipped again and trading sideways( range bound move movement )from the past 2 months.
The Trading Range is of approx 60 points.( 432- 490). This range offers a major support zone for the stock.
Thus these levels are Important Levels to watch : 432 and 490.
Volume are considerable less during this range bound movement.
RSI of the stock is above level of 50.
Immediate supports are at 460 & 433.
Further support is at 400, 388, 342.
.
Wednesday, December 3, 2014
.png)
.png)
Friday, November 28, 2014
Bearish Gartley on the daily Charts of IDEA CELLURAR LTD
.png)
A Bearish Gartley is apparent on the Daily Charts of Idea Cellurar Ltd.
Lets examine this Bearish Gartley Pattern :
- Stock Slipped from point X( marked) to Point A.
- Stock retraces about 61.8% of the XA move, from the point A to Point B
- Stock then peaked at Point B, price again slipped to the point C. The BC move retraces 61.8% of the AB rise.
- Stock then rises from Point C to peak at Point D. The CD move was 161.8 % of the BC move.
- This Pattern would be negated , If price rises above Point X.
Since this is a Bearish Pattern, stock may see lower levels in the near term, thus on the downside:
- First Target is at Point B.( already achieved on 24-Nov-2014.)
- Second Target is at Point C.
- Third Target is at Point A.
- Stop is to be placed at Peak Point D, or at Point X.
*********************************************************************************
Point X is at 178.40.
Point A is at 145.25
Point B is at 166.2
Point C is at 154.1
Point D is at 173
XA move is of 32.74 points, comprising 18.38%.
AB move is of 20.09 points, comprising 12.60%
BC move is of 12.13 points , comprising 7.29%
CD move is of 18.89 points, comprising 12.25%
DB move is of 6.76 points, comprising 3.90%
DC move will be of 18.89 points, comprising 10.90%
DA move will be of 27.72 points, comprising 16.01%
*********************************************************************************
Thursday, November 27, 2014
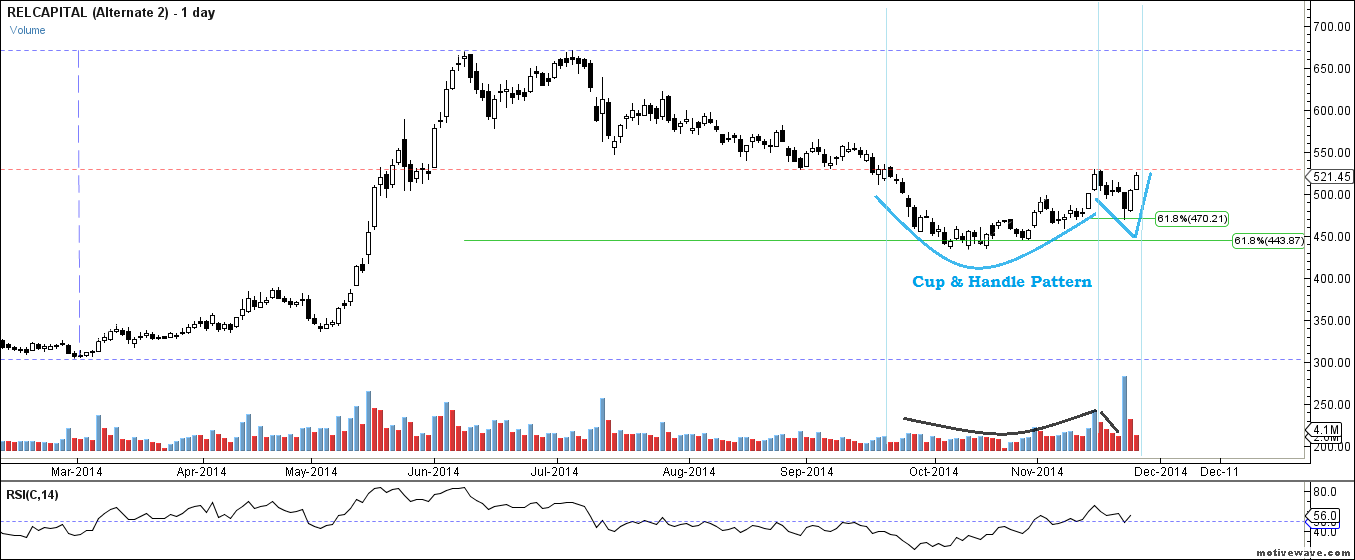
Cup & Handle Pattern is seen on the daily charts of Reliance Capital
.png) |
| Daily Chart |
- Reliance Capital had made a remarkable rally from the level of 300 to 672 , thereafter stock showed a time wise & price wise correction and slightly exceeded 61.8% retracement of this rally however took support at it, forming higher lows shaping into rounding bottom.
- This rounding bottom rally took resistance at previous bottom resistance zone of 528- 530.
- It again slipped into correction and retace about 61.8% of its rounding bottom rally from 433.25 to 528 and bounce therefrom to test the previous resistance at 528.
- It made a cup & handle pattern, which is a Trend reversal pattern & Bullish continuation pattern , examination of which are herein below:
- The top of the cup is formed around levels of 528-530 on 17th September, 2014 and 19th November, 2014 consisting approx 2 month.
- The Bottom of the cup made a low of 433.25 on 13th October, 2014.
- The depth of the bottom is of approx 100 points.
- The stock slipped from the level of 530 which is the previous bottom resistance on 19th November 2014 to the level of 470 which is 61.8% retracement of bottom rally from 430- 530, forming handle consolidation.
- On 26th November, 2014 a rally is seen from this support level & is expected to test previous resistance level of 530.
- A break above 530 could take the stock to the higher levels or a further consolidation may be seen in the range of 470 to 530.
- A break below 470 levels would negate the said pattern formation.
- Volume were curving up during bottom formation, while it dries during handle formation.
Wednesday, November 19, 2014
.png)
.png)
.png)
.png)
Thursday, November 13, 2014
Head & Shoulder Pattern is visible on the 15 minutes chart & Bearish Belt hold candle on Daily Chart of CNX NIFTY
.png) |
| 15 Minute Chart |
Near Term Resistance 8362
Near Term Support 8355, 8320, 8300, 8280
.png) |
| Daily Chart |
Wednesday, November 12, 2014
.png)
Friday, November 7, 2014
.png)
.png)
.png)
.png)
Tuesday, November 4, 2014
IDEA CELLULAR - Weekly Chart Review
.png) |
| Weekly Chart |
.png) |
| Head & Shoulder Pattern at Daily Chart |
- We had seen a remarkable rally in the Idea cellular post breakout from the resistance zone of 145 -150.
- After making a high of 178.40 , we had seen a price correction till 61.8% of its previous rally from 125.10 to 178.40.
- A long legged green candle is seen at 61.8% retracement support of its previous rally from 125.10 to 178.40, following such candle stock is seen resuming its previous uptrend.
- Looking at the weekly chart, i can see it forming an inverse Head & Shoulder Pattern, right shoulder of which is due to form, similarly neckline resistance of which is standing at the level of 177.
- This Pattern will be valid, when a weekly breakout from the level of 177 would take place.
- Immediate resistances are at 165.80, 171.40, 178.40.
- Immediate supports are at 161.30, 158.20, 155.73, 153.25
Monday, October 13, 2014
CNX NIFTY : Breakdown from the Head & Shoulder Neckline
.png) |
| Breakdown From the Head & Shoulder Neckline |
- A Gap Down Opening took place on friday's session and selling pressure continued through out the session, forming second right shoulder.
- Index again opened today on a weaker note via Gap-down opening.
- Index opened below the neckline of Head & Shoulder Pattern.
- As of now we had seen intra-day breakdown from H& S neckline.
- A close under the Head & Shoulder Neckline would validate the breakdown and the said pattern.
Near Term Resistance : 7825, 7830, 7840.
Near Term support : 7800, 7774, 7757
-----------------------------------------------------------------------------------------
For previous analysis, please click on the links below:
http://techincallearning.blogspot.in/2014/10/cnx-nifty-double-head-shoulder-pattern.html
http://techincallearning.blogspot.in/2014/10/cnx-nifty-daily-review-at-closing-7th.html
http://techincallearning.blogspot.in/2014/09/cnx-nifty-daily-review-at-closing_26.html
Friday, October 10, 2014
CNX NIFTY: DOUBLE HEAD & SHOULDER PATTERN ON HOURLY CHART
.png) |
| Double Head & Shoulder Pattern |
http://techincallearning.blogspot.in/2014/10/cnx-nifty-daily-review-at-closing-7th.html
Index Bounced from the Head & Shoulder Pattern Neckline.
Index then took Resistance around 7970 levels.
In today's session a Gap Down Opening is seen forming Second Shoulder, hence second right shoulder is now visible on the hourly charts.
Strong support is at 7840, 7830.
Tuesday, October 7, 2014
CNX NIFTY: Daily Review at Closing-7th October,2014
.png) |
| HOURLY CHART |
- In the Previous review, we have taken a probability that CNX NIFTY INDEX might be forming complex Double Head & Double Shoulder pattern.
- Accordingly in the last few session, we have seen that Index first bounced to 8030 level and then again started falling, hence a right shoulder is now visible on the hourly charts.
- Neckline of the Head & Shoulder Pattern is standing around level of 8040.
- Now the probabilities are that :
- It will make an another right shoulder, before breaking down from the pattern.
or
- A breakdown will take place without forming another shoulder.
--------------------------------------------
Resistance : 7930, 7970, 8000
Support : 7850, 7840, 7800, 7750
For previous Analysis , please click on the link below:
Wednesday, October 1, 2014
USD/INR CHARTS REVIEW
 |
| INVERTED HEAD & SHOULDER PATTERN IS SEEN ON THE DAILY CHART OF USD/INR |
 |
INVERTED HEAD & SHOULDER PATTERN PROJECTION
HOWEVER BREAK OUT FROM THE PATTERN IS NOT YET TAKEN PLACE.
|
 |
| HIGHER TOP, HIGHER BOTTOM FORMATION IS SEEN ON THE WEEKLY CHARTS OF USD/INR. |


Friday, September 26, 2014
CNX NIFTY: Daily Review at Closing,
.png) |
| Hourly Chart |
- Nifty Negate the Double Top Pattern in today's session as it closed above 7925( the support broken yesterday).
- So now we have a Probability that it might be forming complex Head & Shoulder Pattern.
- Double Left Shoulder
- Double Head
- Down Sloping Neckline
- The above probability will be negated in case nifty breaches level of 8030 on the upside.
Thursday, September 25, 2014
CNX NIFTY: Daily Review at Closing,
.png) |
| Hourly chart |
.png) |
| Daily Chart |
Resistance : 7940, 7970, 8030.
Support : 7860, 7830, 7790, 7670, 7650.
.png)
Wednesday, September 24, 2014
.png)
Wednesday, September 17, 2014
CNX NIFTY: Daily Review at Closing-17th September, 2014
.png) |
| Hourly Chart |
- During yesterday’s session we had seen a breakdown from the strong support zone of 8000-7970.
- In today's session a gap up opening is seen, however it was a range bound session wherein nifty took resistance around level of 7990 and hold minor support around 7940 and able to close near day's high.
- Immediate Resistance : 8000, 8010, 8060.
- Immediate Support : 7940, 7920
Tuesday, September 16, 2014
CNX NIFTY: Daily Review at Closing-16th September,2014
.png) |
| Head & Shoulder Projections |
- In Yesterday's session, we had seen a breakdown from H & S Pattern via Gap Down Opening and a pullback to the neckline of the H & S Pattern.
- In today's session, we had seen a follow-up sell-off, completing H&S Pattern Projections.
.png) |
| Hourly Chart |
- In Today's session a psychological support level at 8000 & important support level of 7970 was broken decisively.
- Successive Support is at 7920 & 7860.
- Immediate Resistance is at 7970 & 8000.
http://techincallearning.blogspot.in/2014/09/cnx-nifty-daily-review-at-closing_15.html
Subscribe to:
Posts (Atom)