Wednesday, October 21, 2015

NIFTY TECHNICAL REVIEW


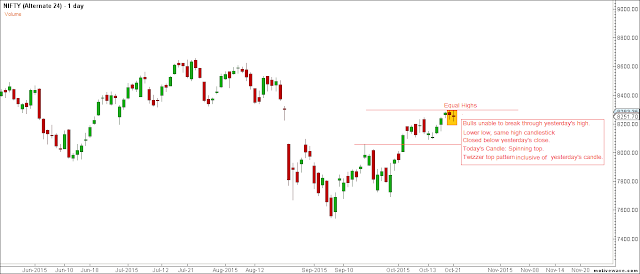
Nifty daily chart witnessed tweezer pattern, wherein prices held twice at the exact same level, it essentially indicates very short-term double top wherein bulls were unable to drive prices higher.

However, High formed by the two candles should hold therefore it is important to carefully watch the price action that occurs immediately after this tweezers Pattern.

Near-term Resistance is at 8294 levels.
Near -term Support is at 8225-8200 levels.

Let's move to the weekly chart:


Nifty is trading in a downsloping channel.

The Lower Top Lower Bottom formation is intact as yet.

Last week candle is Dragon fly candlestick pattern which is formed near 8250 resistance level, adding a caution for the existing longs.

The Further Weekly Resistance is at 8327-30 levels.



ONGC : HARMONIC REVIEW


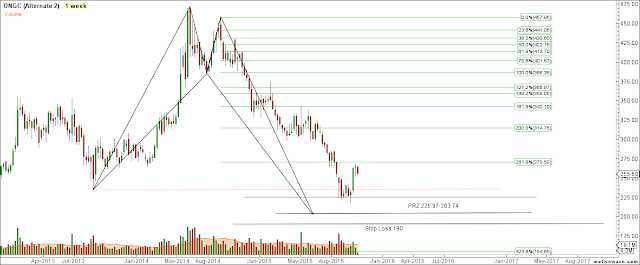
  • ONGC has Bullish Harmonic Pattern named ALT BAT on its Weekly  chart.
  • Stock has already bounced from its prz area.ie. 203-225, however, any dip can be utilised for buying.
  • Any Close below prz area would the said harmonic set-up.

Near-term supports are at 248, 233, 225

Near-term resistance is at  264-270, 285 

OIL INDIA LIMITED: HARMONIC REVIEW


  • Oil India has Bullish Harmonic Pattern named Shark probability on its Weekly  chart.
  • Currently, Stock is trading its prz area. i.e. 382-443.
  • Any Close below prz would the said harmonic set-up.

Near-term supports are at 415-412, 405-400.

Near-term resistance is at  456, 470, 484, 503.

RELIANCE : HARMONIC REVIEW


  • Reliance has Harmonic Pattern named ALT BAT probability on its daily chart.
  • Follow up Price Action in the direction of said probability will be  important for  determining the future trend of the stock.
  • Buy on dips strategy can be opted in the stock as long as it trades above 900 levels.

Near-term supports are at 944-955, 900-920.
Near-term resistance is at  972-974, 1014-1018.

Thursday, October 8, 2015

Aditya Birla Nuvo Ltd:Harmonic Review

ABIRLANUVO - Alternate 1 - Oct-07 1831 PM (4 hour)
A bearish Gartley Pattern was seen on Abirla Nuvo charts.
Stock was seen making bearish candles at gartley prz area.

Wednesday, October 7, 2015

Nifty Harmonic Review

In our previous review, we have discussed the range created in the index, this week, we  have seen an upside breakout from that range, thus the upper band of that range( 8060) could serve as immediate support for any pullback rally if seen.
Now let us review harmonic probabilities on daily charts.
On daily chart, index has two harmonic pattern probability:
NIFTY - Alternate 10 - Oct-07 1533 PM (1 day)
NIFTY - Alternate 9 - Oct-07 1533 PM (1 day)

Continue Reading

Tuesday, October 6, 2015

Tatamotors : Harmonic Review

TATAMOTORS - Alternate 2 - Oct-06 1325 PM (1 week)
The price action on Tata motors weekly charts, after violating its 1.618 projection, had tested its extreme 2.24 Fibonacci projection and quickly reversed therefrom.
This 2.24 extreme projection are quite important for gauging trend reversal, hence price action at these numbers are very important to watch, as reversals from these numbers are usually quick and fast.

 Continue Reading

Thursday, October 1, 2015

RPOWER :HARMONIC REVIEW

RPOWER :HARMONIC REVIEW


REVIEW 1:

RPOWER - Alternate 1 - Sep-10 1614 PM (1 week)
Post dated 10th Sept 2015: In our weekly harmonic review, we found bullish abcd pattern on Rpower weekly  chart, wherein we were expecting a bounce from its prz area, As expected prices reversed exactly from its prz area,
This entire pattern completed in 3.5 years. which is an important time cycle, hence this pattern provided us with an important support zone.

REVIEW 2

RPOWER - Alternate 1 - Sep-21 1505 PM (1 day)
Post Dated 21st Sep, 2015: We found Bearish Bat formation on its daily chart, wherein we warned that stock is approaching its critical resistance area i.e 43.8 – 46.40, and longs should look for booking profit near these levels.

RPOWER - Alternate 1 - Oct-01 1836 PM (1 day)
As expected stock, in today’s stock tested pattern prz area, and closed in red.
Hence Sustenance above 47 levels can only trigger further buying in the stock, else we could see stock testing 39-40 levels on the lower side.