Thursday, May 29, 2014

OPTO CIRCUIT ( I ) LIMITED trading in an up-trending channel.


  • Stock had seen a sudden , sharp major fall from the level of 278 to  level of  17.75, which eroded almost 92 % of its price.
  • Stock started stabilising and forming a base at the levels of 17 -18, and from there started forming higher lows/ bottoms.
  • Stock is now trading in a up-trending channel.
  • In the begning of this year, stock has found forming bullish flag pattern followed by a bulliish continuation, cup and handle pattern.
  • Stock acheived its Cup and handle target, which came near the level of 44-45.
  • Immediate Resistance for stock is at the level of 44, 48.
  • Immediate Support is at 36.5 , 34.5.
  • However in today's session it made a  gap up- red shooting star pattern at its resistance level, signalling bears are too in strenght, though this is gap-up shooting star, this gap may serve as minor support, however if this gap is filled, stock may test its previous support levels at 36.5 and 34.5.
  • RSI though giving mixed signals, as  negative divergence followed  by curving up towards reading of 70%.
  • Stochastic  is about to make postive crossover in the middle, indicating strength in prices.
  • ROC is still moving up , signalling strenght in momentum.
  • OBV is also increasing, means volumes are still good.
  • MACD Bars are though moving-down,  however Macd Line is still curving-up.


Wednesday, May 28, 2014

POWER GRID CORP LTD


Thursday, May 22, 2014

IDEA CELLULAR REVISTED


  • On 20th May, Stock broke-up with down-ward sloping trend-line with a volume expansion, but took resistance, but took resistance at 38.2% retrace-ment of its previous downfall from 188 to 125
  • In the next session it lost all of its price gained in previous session, forming Bearish Engulfing Pattern, with shadows on the both side [ Such made lower high and , lower low than previous session and closed under the previous session, which shows weakness may continue in next session , if prices opened under the middle of this candle.
  • Like-wise today opening took place at middle of previous candle and prices headed lower and closed almost near its low, signalling weakness may continue in tomorrow session.
  • Initial Stop-loss of 140 is triggered in today's session.
  • Stock tested its 30 day moving average and still standing above it.
  • Stock is likely to take support at levels of 137, 135, 133, 129,125.
  • Stock may face minor resistance at 141.5.

CNX NIFTY

Daily Chart

  • Unusual High volumes at market highs usually , suggests to  traders and investors to follow, a cautionary approach towards markets, and stay light.
  • Small red bodied candles at highs, suggests that new buying is drying-up or market is taking breathier before carrying further the previous move.
  • There is a possibility that nifty may have volatile session tomorrow.
  • Market may take support at the levels of 7200, 7130 on the downside in tomorrow's session.
  • On the upside  7350, 7400 could act as resistance in tomorrow's session.
  • Rising Window support came at 7020.05 -7067.15
  • RSI:  Is flattened in the overbought territory, signalling prior move may change.
  • Stochastic: D% line move under the K% line, while K% is line flattened, preceded by a negative crossover, signalling pause in upside momentum.
  • MACD Bars are also turning down.
  • On Balance Volume is increasing, while prices are flattened or range bound.
  • Moving Averages are still curving-up, suggests, prior move may continue.
  • Bollinger Bands are widening volatility may increase and nifty may try, to ride the upper Bollinger band.
  • ROC: Indicating upside momentum may continue.


ANALYSIS:

  • Price Action and indicators are giving mixed signals.
  • Tomorrow closing [ Weekly] is important, as to which way market will move.

NSE : EXIDEIND {Head and Shoulder continuation pattern seen in Exide Industries Ltd}

Daily Chart [ Zoom in ]
Head and Shoulder target projection[ Daily Chart- Zoom out]
Weekly Chart

Wednesday, May 21, 2014

Seems bulls are on the driving seat of IDEA CELLURAR LIMITED


Daily Chart
Weekly Chart

Price Action
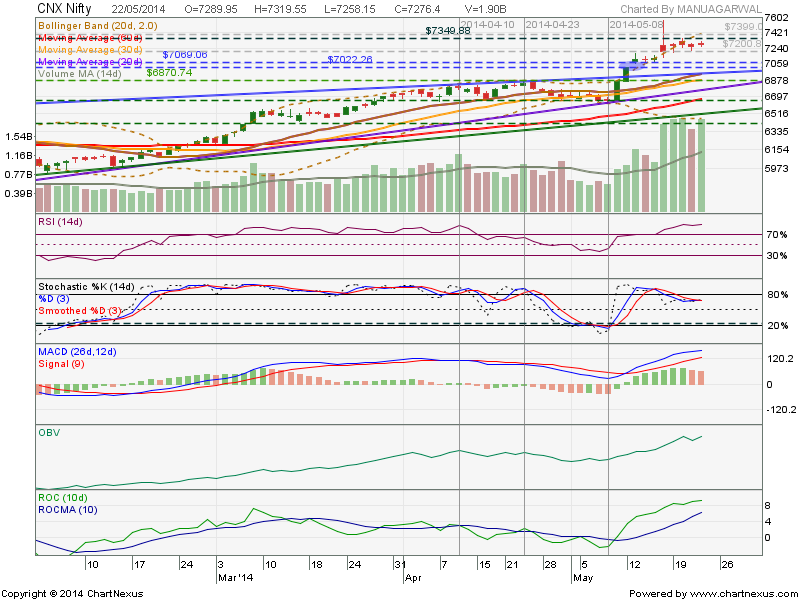
  • Stock broke-up with down-ward sloping trend-line  with a volume expansion.
  • Stock is likely to form higher-top, higher bottom formation.
  • Can be seen as forming double bottoming -out pattern, if stocks sustains above level of 150

Candle-Stick formation on weekly chart

  • Previous bottom is made via bullish hammer.
  • The said hammer is followed by a bullish belt hold candle, which is a bullish contiuation pattern.
  • Both candle indicates , that upward -rally is likely to continue in the near term.


Indicators

  • Moving Average : Trading above 30 day moving average, and also curving up- signalling strength in upside -momentum.
  • Stochastic : Indicator is consistently pointing-up,likely to move into reading above 80 signalling strength in upside -momentum.
  • RSI : Indicator is pointing-up , moving above reading of 50% , making higher high, higher low, signalling strength in stock
  • MACD : Indicator has shown positive crossover and pointing-up and MACD bars are also making newer highs.
  • ROC : Indicator signalling strength in up-side momentum.
  • Volume : Volume is expanding with the prices rallying-up.

Analysis:
  • Price action and Indicators are in favor of bulls, thus one can follow buy on dips strategy in this stock.
  • If stock succeeds in breaching levels of 149, it can test levels of 157, which is the 50% retrace-ment of its previous downfall from the level of 188.4 to 125.1. 
  • Likely levels that can be seen on the up-side are 157, 164, 175.
  • Trailing Stop loss is placed at 140, 137, 133, 130.


POLARIS DAILY CHART ANALYSIS


Monday, May 19, 2014

BOMBAY DYEING : Breakout from falling wedge pattern is on the cards


Price Action
  • Falling Wedge Pattern is apparent on the daily charts [ Each successive wave is feebler than the previous wave within the pattern ]
  • The corrective wave within wedge pattern turned before touching up-sloping trendline and took support on previous rising window.
  • Higher low pattern is visible.
  • Breakout on the upside ,from the down-sloping trend-line is likely on the cards

Candlestick Patterns
  • Bullish Belt hold candle appeared at support, covering in whole previous black candle.
  • Another Bullish belt candle followed by upside -gap.
  • Long bodied white candle closed near it high with good volume ,appeared at the support of 30 day moving average, indicating near term bullishness.
Bollinger Bands
  • Bollinger Bands are broadened, indicating volatility.
  • Price is riding at the average of  Bollinger Band.

MACD
  • MACD showing bullish crossover and pointing-up , indicating s an acceleration based on the recent near crossing.
  • Histograms are making a new high

MOVING AVERAGE
  • Stock is trading above 200, 100, 50 day moving average.
  • Currently it is standing at support of 30 day moving average, and the average is also curving-up.


STOCHASTIC
  • Stochastic continues to point-up 
  • It is moving above middle territory indicating strength in prices

VOLUME
  • Volume diminished when  prices moving -down with the pattern.
  • Volume is increasing when prices rallied -up within the pattern.
  • Volume pattern signalling strength in stock.

ANALYSIS
  • All indicators and price action signalling strength in stock.
RESISTANCE
  • Levels of  70 and 80 may act as possible resistance in the near term.
SUPPORT
  •  Stock is likely to take support at the levels of 54 and 60.

ANSAL PROP & INFRA LTD


Thursday, May 15, 2014

BOTTOMING PATTERN IN TATA STEEL LIMITED [NSE :TATASTEEL]


Price Action
  • Head and Shoulder Bottoming Pattern formed and price has broken the neckline and previous top to confirm an uptrend.
  • Price made a new high [ higher high ]  with a current bullish candle which closed near its high.
  • Breakout on the upside ,from the down-sloping trending, with good volume.

Candlestick Patterns
  • Piercing Pattern appeared at the support of 30 week moving average, indicating near term bullishness.
  • Bullish Belt hold candle appeared which opened at previous close and almost closed near its high

Bollinger Bands
  • Bollinger Bands are flattened, indicating range bound price action or a base formation.
  • Price is riding the upper Bollinger Band indicating increased momentum.
  • Price has pulled back to Bollinger band moving-average.

MACD
  • MACD continues to point-up and indicates an acceleration based on the recent near crossing.
  • Histograms are making a new high


MOVING AVERAGE
  • Major Moving averages are curving-up


STOCHASTIC
  • Stochastic continues to point-up in an overbought territory.
  • It is moving in a overbought territory indicating strength in prices

ANALYSIS
  • All indicators and price action signalling strength in stock.

Thursday, May 8, 2014

BHARTI AIRTEL LTD

Daily Chart

  • Stock is standing at its 61.8% retracement of its previous rally from 281.9 - 345.5.
  • Stock is standing on its uptrendline support at 306, which is also 61.8 %  retracement of its previous rally.
  • Stock may face resistance at 314.
  • Stock is trading under 30 day moving average and average is also curving over.
  • 60 day moving average is turning flat.
  • Stock had made new low continuously in every trading session from  past 7 trading sessions, however today's session , it does'nt tested yesterday's low, but the closing came under the yesterday's closing.
  • OBV is also declining.
  • RSI is turning down.
  • Stochastic is under reading of 20, signalling weakness.
  • MACD is also turning down plus MACD bars are rising on the downside, 
  • Stock levels on the upside - 314, 318.
  • Stock levels on the downside - 306, 299.

ADANI POWER LTD


Daily Chart

  • Stock is Trading under 30 day moving average and average is curving over.
  • Stock is Facing resistance at 30 day moving average from past 5 trading sessions [ Formed four small bodied candles with shadows on both sides, representing tug of war between bulls and bears, out of which 3 are balck bodied, and one long black candle is formed at 5 th day, which opened at its high and closed at its low, showing that bears have taken control over bulls.
  • Hence stock may test 50% retracement of its previous rally [ 31.8 - 59.25 ], standing at 45.66. and also 61.8% retracement at 42.7, which is also a previous top and can serve as a good support for the stock.
  • However 60 day moving average is still moving-up.
  • Upward Channel breakdown is seen on the charts.
  • On- Balance Volume is also declining.
  • Volume is also diminishing.
  • RSI is curving up.
  • Negative crossover is seen in stochastic.
  • MACD is also turning down and its bars are also rising on the downside.