 |
| Daily Chart |
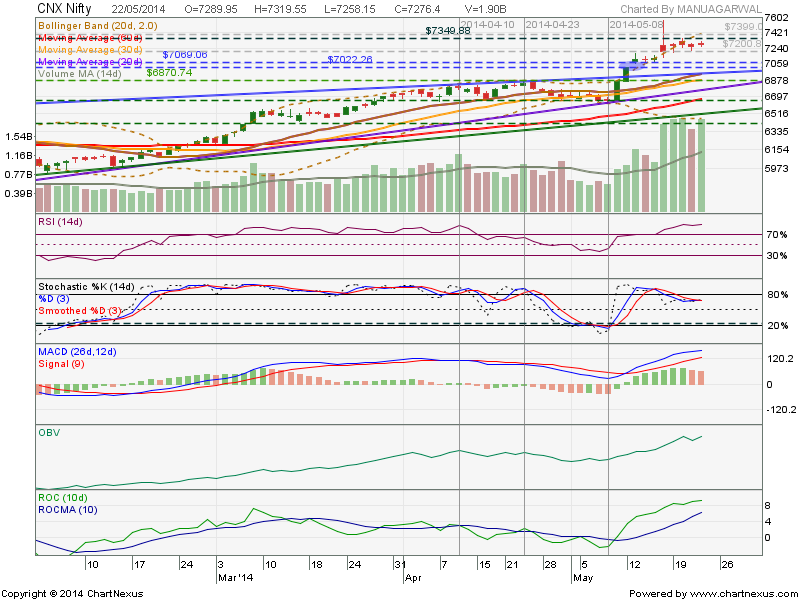
- Unusual High volumes at market highs usually , suggests to traders and investors to follow, a cautionary approach towards markets, and stay light.
- Small red bodied candles at highs, suggests that new buying is drying-up or market is taking breathier before carrying further the previous move.
- There is a possibility that nifty may have volatile session tomorrow.
- Market may take support at the levels of 7200, 7130 on the downside in tomorrow's session.
- On the upside 7350, 7400 could act as resistance in tomorrow's session.
- Rising Window support came at 7020.05 -7067.15
- RSI: Is flattened in the overbought territory, signalling prior move may change.
- Stochastic: D% line move under the K% line, while K% is line flattened, preceded by a negative crossover, signalling pause in upside momentum.
- MACD Bars are also turning down.
- On Balance Volume is increasing, while prices are flattened or range bound.
- Moving Averages are still curving-up, suggests, prior move may continue.
- Bollinger Bands are widening volatility may increase and nifty may try, to ride the upper Bollinger band.
- ROC: Indicating upside momentum may continue.
ANALYSIS:
- Price Action and indicators are giving mixed signals.
- Tomorrow closing [ Weekly] is important, as to which way market will move.

No comments:
Post a Comment