Monday, April 7, 2014

NSE : TATA MOTORS LIMITED [ PRE-MATURE DOUBLE TOP PATTERN ]


·    PRE-MATURE DOUBLE TOP PATTERN
·         Stock pullbacks from its previous peak made at 418
·         FIRST PEAK/top is made around 28th Feb, 2014 -4th March, 2014 via bearish harami followed by spinning tops and black candles in the price range of 418.2 -420.7
·         SECOND PEAK /top is made via Bearish hanging man on 3rd April, 2014 at 418, which is followed by long black candle, which opened at its & closed near its low
·         These peaks are month apart.
·         Trough is made on 20th March, 2014.
·         However this pattern would qualify as a double top, if support near 378 is broken on a closing basis.
·         In case stock bounces off from its support, the whole said view will be negated and it is viewed it was a temporary setback in the existing trend and likely to resume its previous up-trend.
·         Indicators are on the sell side, returned from the overbought zone.
·         RSI is showing negative divergence.
·         MACD  is showing negative divergence.
·         Histograms are also turning down.
·         Stochastic has given negative crossover in the overbought zone
·         However currently stock is standing at its window support at 402.55 and also at up-slanting trendline.
·         In Yesterday’s session stock opened above the window support and rallied then faced resistance at 50% retracement of previous long black real body and turned down, tried  breaking  window’s support at 402.55 but managed to closed  above it.
·         30 day moving average is standing at 399.

The whole view be negated , in case stock went above levels 418-421.

Yes Bank Ltd [ Inverted Head and Shoulder ]


  • Inverted Head and Shoulder pattern is seen on the daily charts.
  • Breakout from the neckline occurs  via long white candle having insignificant shadows [ signalling strength of bull]with considerable rise in volume.
  • After breakout stock struggles to rally up because it was standing near  previous peak resistance at 415,  however it managed to give three closes above the said resistance including friday's closing above 415, and  3% filter is also passed ,confirming a breakout, but volume support is little bit slackening
  • Stock also managed to close above previous window resistance  zone of 423-428.25.
  • Stock may test on the up-side the levels of 435, 442, 455, 480.
  • Bullish Engulfing at the resistance level is suspect able.
  • On the other hand indicators are are showing divergences:
    • Stochastic is flattening in overbought zone
    • RSI is showing negative divergence .i.e RSI is turning down while price are moving-up.
    • Histograms are turning down, however MACD line is still turning -up
    • OBV is also turning -up , supporting the current move.

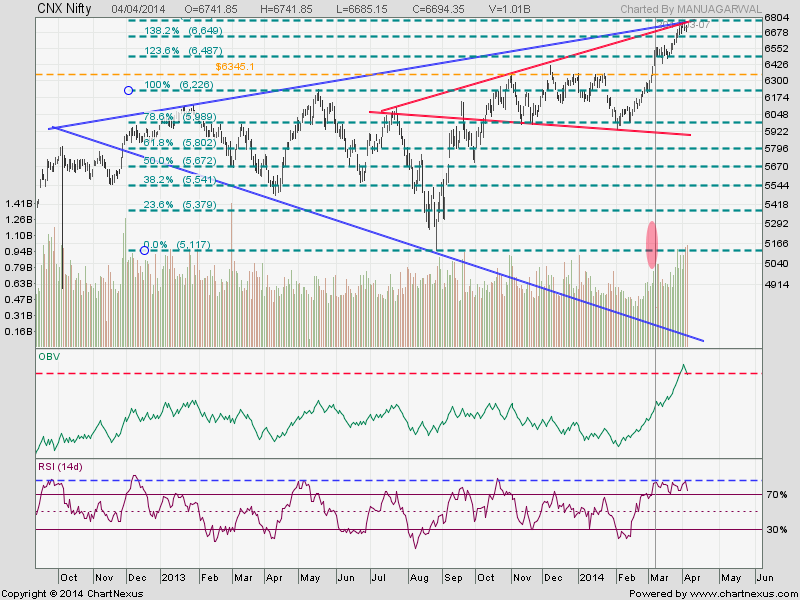
CNX NIFTY

DAILY CHART

WEEKLY CHART

Thursday, April 3, 2014

NSE: NTPC [ Double bottom consolidation is seen with significant volume ]


Double Bottom Formation: 
  • Double bottom formation and  breakout is seen with significant volume in daily charts.
  • Stock may test on the upside the levels of 125, 128.6.
  • Stock may face minor resistance at 123.5
  • Stock is having support at levels of 122, 119.
  • Intraday support is placed at 122.5
  • Stop loss is placed at 118.
Indicators:
  • RSI :RSI formed double bottoming pattern  and showing a positive divergence at second bottom, and consistently moving up.
  • STOCHASTIC :  very close to turning up.
  • MACD:  It is turning-up, and histogram bars are also rising
  • BOLLINGER BANDS : They are contracting and flattening indicating a  base formation.
  • 30 SMA : Stock is trading above 30 day simple moving average.
  • VOLUME :  Double bottom consolidation is  seen with significant activity in volume.

Wednesday, April 2, 2014

Bank nifty daily chart


NSE : ADANIENT [ ADANI ENTERPRISES LTD} Bearish engulfing on daily charts.


 First Instance:

  • Bearish Engulfing pattern on daily charts, showing profit booking at higher levels.
  • RSI is showing negative divergence  on weekly charts, while prices on the same are turning-up.
  • RSI went under the levels of 70 in the daily charts.
  • Stochastic giving negative crossover in the overbought zone.
  • MACD  line is turning flat, and histograms  are also declining, signing trend change in the short term
  • Trailing stop loss is place at 360, 370.
  • Stock may test on the downside the levels of 350, 340, 335.


On the flip side:
Stock has moved above the up-trending channel, and has also given breakout from a up-slanting pennant.
Stock has got good support zone at  350-352, 340-342.


Tuesday, April 1, 2014

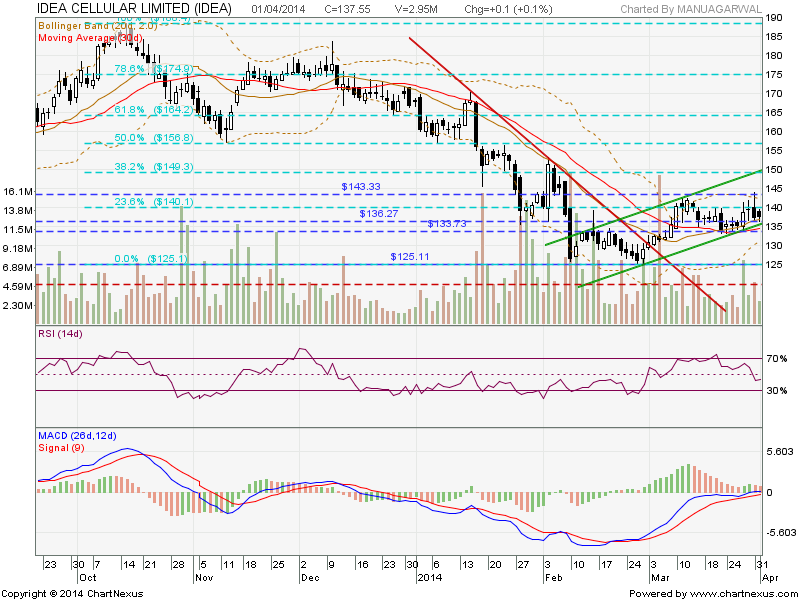
IDEA CELLULAR LTD is trading above 30 day moving average .[ Higher top- Higher bottom formation ]


  • Stock's today session was within the previous session, forming an inside candle at  previous bottom's support
  • Stock has been trading in a up-trending channel,making higher top -higher bottom.
  • Stock had taken minor resistance at 23.6% retrace-ment ,of its previous downfall from 188.4 to 125.1.
  • Stock is trading above 30 day simple moving average.
  • Volume declines when prices rallies down.
  • RSI is flattened and turning -up
  • Diminished black real body, signalling a strength in stock.
  • Stock may test levels of 143, 150.
  • In case stock again tested  levels of 133, it may then be seen as forming rectangle consolidation.
  • Stop level is placed on 133.