Monday, June 22, 2015

How i traded failed Bearish Bat


Nifty had Bearish Bat on its its daily chart, it took resistance primarily at .886 retracement of xa leg, but exceeded this resistance via long bullish candle which closed at its high, and also negated bearish bat pattern .

Thus then this bearish bat , turned into bearish crab pattern , which could take nifty to 1.618 retracement of xa leg.

However Nifty exceeded 1.618 projection of xa leg of bearish crab, which indicates, the prevailing trend is quite strong. and can further take nifty to 2.0 , 2.24, projection of XA leg, such moves are usually sharp and could also call for sharp reversals, thus should be traded with strict stop losses.


Wednesday, June 17, 2015

CNX Nifty & Bank Nifty Harmonic Perspective


Nifty intra [ 15 min ]charts had two successive bullish shark patterns( usually believed as higher reliability bullish pattern) , which led a sharp straight rally which even exceeded the high point of shark pattern.
That high point i.e. 8058-50 level have now become the support area for the near term.
Lets look at Nifty Hourly chart:
  • As of now, Nifty hourly chart  has Bearish Bat pattern { bearish candle appeared near prz area)
  • Any break below 8050, could trigger weakness in the index.
  • Any close above X point would negate the Bearish Bat pattern.
------------------------------------------------------------------------------------------------------------
Lets looks at Bank Nifty Hourly Chart
  • Banknifty Hourly chart has Bearish Gartley Pattern[ Marked by xabcd] and these pattern usually develop  within the constraints of the channel.
  • Indecisive candles can be seen near prz area.
  • Any close above x point would negate the Bearish Gartley Pattern.
There is also a probability of Three bullish Driver Pattern on the  Bank nifty chart, of which Point 1 and Point 2 [ Marked in Red Font ]are already established.

Wednesday, June 10, 2015

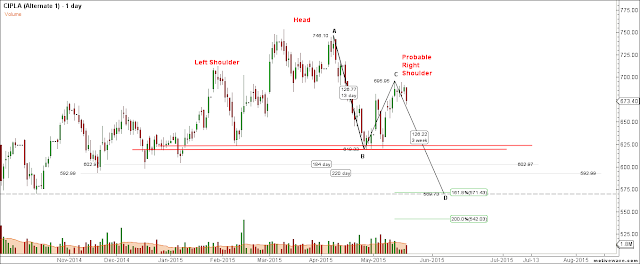
NSE: CIPLA- Bullish ABCD Pattern Performance Statistics

CIPLA : Bullish ABCD Pattern Performance Statistics


  • ABCD patterns are quite easy to identify on charts( any time frame)
  • It consist of 3 legs, and looks like zig-zag patterns.
  • AB=CD patterns are made up of equal price legs( price wise and time wise)
  • In Ideal ABCD pattern, BC leg usually retraces .618 or .786 of AB leg.
----------------------------------------------------------------------------------------------------------
  • On Cipla weekly chart, a straight sharp fall i.e a implusive move from 746.80 to 618.75 were seen. This fall was completed in 4 weeks.
  • The said fall was then followed by a rally which retraces .618 of it and this retarcement ratio is usually treated as ideal ratio for abcd pattern , thus a probabilty of bullish abcd pattern is identified of which two legs were already in place.
  • A bearish harami was seen near .618 retracement, thus further supporting the probabilty.
  • According to this probability cd leg is expected to be of 128.05  points or 1.618 projection of bc leg and to be completed in 4 weeks 
  • As expected, cipla weekly charts unfolded the bullish abcd pattern.
  • Currently we are in the 4th week of cd leg and the pattern is near its completion point i.e 573- 565
  • Lets looks at identification and near completion charts:

Weekly Chart as on 22-05-2015 

Weekly chart as  on today ( ABCD Pattern near completion point)
Since this is a bullish abcd pattern , probability of a bounce from the pattern completion point cannot be ruled out.
573-565 can be treated as Potential reversal area of this bullish abcd pattern.

Any close below PRZ area would negate the said probability.

---------------------------------------------------------------------------------------------------------
Daily Chart as on 22-05-15
Daily Chart as on today 

Wednesday, June 3, 2015

CNX NIFTY: Daily Review at Closing: Bullish bat probability emerged on hourly chart

CNX NIFTY: Bullish Bat Probability

  • CNX Nifty hourly chart is depicting Bullish Bat  probability on it( marked by xabcd)
  • RSI is also showing positive reversal in the deeply oversold area.
  • Indecisive  candles with long lower shadows and bullish belt hold candle emerged in bullish bat prz area.
  • PRZ area falls near previous support area.
  • Any close under x point would negate the said pattern.

Any close above PRZ area's  would Negate the said probability.