Friday, March 28, 2014
Thursday, March 27, 2014
NSE: RANBAXY [ Daily Chart ] Trading above 30 day moving average
- Stock has taken support on 30 day moving average via spinning top.
- It seems to have made bottom at the levels of 335 via hammer of long lower shadow and at 344 via long black body engulfed by long bullish belt hold candle.
- If stock succeeds to cross levels of 375 [as it will be the 3rd attempt to break the levels], it may then test the levels of 412.
CNX NIFTY : Breakout from Bullish Flag/Pennant seen in Daily Chart.
Nifty has made a bottom at 5984, via bullish hammer appeared on 200 day SMA support, preceding long black candle, thereafter gave a sharp rally to the level of 6562, it then went into brief consolidation , in the form of bullish horizontal flag, or pennant having horizontal up-line and up-slanting down -line. In Consolidation phase ,the size of White Real bodies [ Bullish belt hold, Long white real bodies, with no shadows or insignificant shadows]are comparatively greater than the Black Candles[ Small real bodies], signalling bulls are riding the rally and bears are lagging behind. Thus in case , if pattern completes nifty may see a level of 7000.
INDICATORS:
Volume : Diminished in the consolidation phase and picked -up on the breakout.
Bollinger Bands : Are widening, signifying the strength of the upward rally.
RSI : Reading over 70 is also showing strength in upside momentum, though considered as overbought reading.
ROC : The indicator is also turning -up.
MACD: Reading over 70 is showing strength in upside momentum.
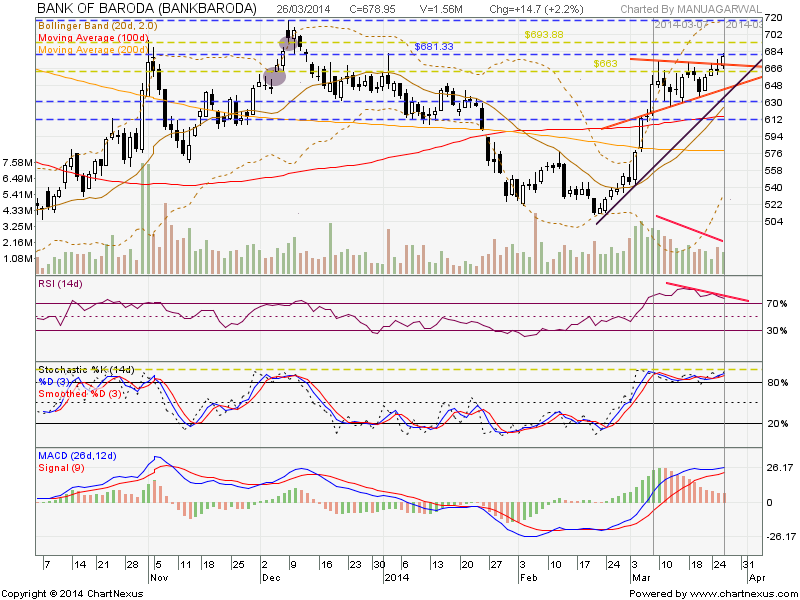
Bank of Baroda [Upside Breakout from Pennant]
BULLISH IN THE NEAR TERM
In furtherance of previous analysis
CANDLESTICK PATTERNS:
- Bullish Belt hold appeared on 21st march and 24th march, 2014, signalling continuation of previous up-trends.
- Long white candles, Spinning top appeared at support levels.
BULLISH PENNANT:
- A Bullish pennant pattern is appeared on the daily charts.
- Volume dried up during pennant consolidation
- Straight move before the the pennant formation.
- Breakout on the upside from the pennant has taken place on 26th march, 2014.
- Caution : Breakout didn't come with the significant increase in volume.
- If Pattern completes, stock may test the levels, of 693, 700, 716, 745, 755.780.
- Stop Loss is placed at 650, 630.
INDICATORS:
- RSI :RSI showing negative divergence, while prices are continues to turning up, however reading above 70 are showing significant strength.
- STOCHASTIC : Giving reading above 80 , signalling strength and still turning -up.
- MACD: It is turning-up, and histogram bars are also turning up.
- BOLLINGER BANDS : Bollinger bands are widened.
Wednesday, March 26, 2014
Bharti Airtel Limited [ NSE : BHARTIARTL ]
BULLISH VIEW
CANDLESTICK PATTERNS:
- Tweezers Bottom appeared on 24th Feb and on 05th March, 2014, after a lengthy downtrend, forming a bottom at 281.9 and giving breakout with a long white candle.
- Bullish Harami/Inside candle appeared on 25th Feb, 06th March.
- Spinning top appeared at support with high volume on 25th march, 2014.
CONTINUATION PATTERN:
- A bullish flag pattern is appeared on the daily charts, if the pattern completes , stock may test levels of 318-320.
- However a suspicion for bullish move in flag consolidation is that, out of 11 candle's, 7 are black candles and 3 are white candle and 1 is doji, thus position should be made cautiously.
- Seems like stock has made at bottom at 281.90.
- Breakout from Downward sloping trend-line of 4 month will come above 295.
- Stop loss is placed at 280.
- Risk reward ratio of 2:1 is favorable.
INDICATORS:
- RSI :RSI formed double bottoming pattern and showing a positive divergence at same price and continues to turning up.
- STOCHASTIC : very close to turning up.
- MACD: It is turning-up, and histogram bars are also turning up.
- BOLLINGER BANDS : They are wide, and flattening indicating a base formation.
- 20 SMA : Stock has been trying to take support on 20 day moving average.
- VOLUME : volume is higher when prices close higher from previous close, and vice-versa.
Saturday, March 15, 2014
Subscribe to:
Posts (Atom)


