Friday, January 31, 2014

PNB Daily Chart [31 -jan-2014] , Windows in between rally from 400.2 to 654.55


  1. Stock has taken support in the range of 509- 515.
  2. Earlier previous falling window[538- 532] could act as possible support.
  3. Resistance  572, 579.
  4. Bullish only above 600.


There is 5 Windows in Rally from 400.20 to 654.55

  1. Rising Window 1 : 419.90 - 425.95
  2. Rising Window 2 : 452.00 - 457.10
  3. Rising Window 3 : 513.45 - 534.30
  4. Rising Window 4 : 572.40 - 579.50
  5. Rising Window 5 : 603.00 - 608.15.


Nifty seen Opening Higher[Bullish Hammer on daily charts]


  • Today's  session was a Gap-Up Opening.
  • Nifty is taking Support at 6070.
  • However It took Resistance on previous falling window at 6109.
  • There is Bullish Hammer in Nifty at its  support at 6040-30.
  • The further support at Nifty came at 5972.
  • 200 day S.M.A also stands at 5972.
  • In case nifty closes under 6030 support, bullish hammer will be discarded and new lows can be seen till 6000 , 5972.
  • However in case nifty succeeds to close above 6110, then levels of 6150, 6170 , can be seen.
  • Fibonacci Retracements levels  are depicted in image below: 


Wednesday, January 29, 2014

Nifty facing resistance at demand line of Triangle Pattern.


Today was Gap -up opening in Nifty.
Nifty traded within the trading range of yesterday session.
It has taken Resistance at Triangle lower up-trending trendline, however it took support at 100 day S.M.A.
Nifty closed at its 100 day Simple Moving Average standing at 6120.
Resistance 6165
Support 6120, 6070, 6050, 6040.

Maruti tested 50% retracement, 200 S.MA, Rising window support.


  • In Yesterday session, there is a fall of 200 [1755- 1540] points in the Stock.
  • Stock had taken Support at 50% retracement standing at 1540 of its previous rally from 1215 to 1860.
  • Stock also tested its 200 day S.MA. standing at 1555.
  • Stock tested its previous rising window support zone standing at 1529-1565.
  • For Previous Analysis, please click on the link below:  http://techincallearning.blogspot.in/2014/01/maruti-weekly-daily-candles-chart.html

Monday, January 27, 2014

Maruti Weekly, Daily Candle Chart Analysis [27- Jan - 2014 ]

WEEKLY CANDLE CHART

  1. Candle 1 : Is Last Bullish Engulfing in an uptrend.
  2. Candle 2 : Is a  Bearish Harami at the upper end of the Long Green Candle, signalling move will halt for few session , and will went sideways.
  3. Candle 3 : Is a Spinning top, with long upper shadows, with high volume, shows there is heavy supply at high prices, & slackening in demand at higher prices.
  4. Candle 4 : Is looks like a doji, with long upper shadow, which is again a bearish signal.
  5. Combined View of all such candles : Out of 6 six candle , four candles are Red/Bearish Candle.
  6. Blended Candle: If we combine all such candles, a candle in the shape of dark cloud cover will be formed.
  7. Support : 1690-92, 1667, 1659, 1600, 1560.
  8. Resistance : 1722, 1755.


  • Stock is  moving under its 25  & 50 day moving average, which indicates, short- term  & intermediate trend is weak.
  • Up-trending Channel is also broken.
  • However a little bounce can be seen till, 1722, 1755.
  • A Head & Shoulder Pattern is also seen,neckline of which is at 1759 , which ultimately gives a target of 1659.
  • 100 day moving average stands at 1600
  • 200 day moving average stands at 1550
  • There is a rising window support zone at 1529-1565.

Nifty Daily chart analysis [ 27 - Jan - 2014 ]


Daily chart analysis

  • Today session was a gap down opening.
  • Market opens under the three month up- sloping trendline.
  • Triangle breakdown is also seen.
  • A further weakened session day after today, can probably confirm  that top has been made.
  • Nifty closed in its support zone of 6130 - 6140.
  • Further Support is at 6100.
  • Major Support is at 5972.
  • However nifty is oversold on intra- day charts, hence a small bounce till 6160, 6180 can be seen.


Friday, January 24, 2014

DIVI'S LABORATORY LTD DAILY & WEEKLY CHART

Daily chart

WEEKLY CHART

ALEMBIC PHARMA DAILY & WEEKLY CHART REPORT

DAILY CHART


WEEKLY CHART

Nifty Weekly chart analysis. 24Jan 2014


  • Appearance of Green candles with long upper shadows , at a resistance area setup earlier by Bearish engulfing, shows that, nifty is exhausting.
  • Moreover  the second green candle looks like a shooting star, which is again a bearish signal.
  • However a confirmation will come only after closing under the shooting star close.

Immediate Resistance 6345, 6375.
Immediate Support 6190, 6130.

RANBAXY DAILY 24-JAN-2014


Thursday, January 23, 2014

EXIDE MONTHLY, WEEKLY CHART

MONTHLY CHART

  • THERE IS A RALLY IN STOCK FROM  34.30 TO 188.20  THAT LASTED FOR 29 MONTHS.
  • THEN STOCK STARTED DECLINING & RETRACED FOR ABOUT 57% OF ITS PREVIOUS RALLY, WHICH COMES AT 100, IN 27 MONTHS.
  • STOCK NOW IS  . TAKING SUPPORT AT  PREVIOUS BOTTOM OF DEC, 2011.
  • SUPPORT IS AT 100.
  • BULLISH ONLY ABOVE 125.


ASHOK LEYLAND MONTHLY , WEEKLY, DAILYCHART


MONTHLY CHART
  • THERE IS A RALLY IN STOCK FROM 6.15 TO 40.95,  THAT LASTED FOR 23 MONTHS.
  • THEN STOCK STARTED DECLINING & RETRACED FOR ABOUT 85% OF ITS PREVIOUS RALLY, WHICH COMES AT 11.75, IN 33 MONTHS.
  • STOCK THEN MADE A BOTTOM IN AUGUST 2013 AT 11.75.
  • NOW STOCK IS TAKING RESISTANCE AT 19.50 WHICH IS THE 26% RETRACEMENT OF ITS PREVIOUS DOWNFALL FROM 40.95- 11.75.
  • HOWEVER LOWER TOP, LOWER BOTTOM FORMATION STAYS INTACT, UNTILL STOCK COMES ABOVE PRICE RANGE OF 21- 23.
    WEEKLY CHART

    • STOCK IS STILL MOVING WITHIN A DOWN-TRENDING CHANNEL.

    • STOCK FACED RESISTANCE VIA BEARISH ENGULFING ON WEEKLY CHART AT [ 19.50] 26%  RETRACEMENT OF ITS PREVIOUS DOWNFALL.

    • IMMEDIATE SUPPORT IS AT 15.


    •  FROM OCT 2013, STOCK IS TRADING IN A PRICE RANGE OF 4 POINTS.[ 15- 19].

    • HENCE A RECTANGLE  CONSOLIDATION PATTERN IS APPARENT , RECTANGLE LOWER RANGE /BOUNDARY LINE COMES AT 15, UPPER RANGE/BOUNDARY LINE  OF RECTANGLE IS AT 19.

    • VOLUME IS PRESUMABLE LESS ON REACTION WITHIN PATTERN, HOWEVER ITS INCREASES WHEN PRICE'S RALLIES WITHIN PATTERN, WHICH IS A PERFECT EXAMPLE OF CONSOLIDATION.

    • BREAKOUT FROM THIS PATTERN WILL COME ONLY ABOVE ITS UPPER PRICE RANGE,, i.e 19-19.5.

    • 200 SMA IS STANDING AT 17.64.

    • IMMEDIATE RESISTANCE IS AT 20, 22, 23.

    • STRONG SUPPORT IS AT 15.


Friday, January 17, 2014

BANK OF BARODA , WINDOWS/GAPS

WINDOWS/GAPS IN BETWEEN RALLY FROM 430 TO 716.95


  • Rising Window 1      467.40 - 472.85
  • Rising Window 2      534.9 - 546.75
  • Rising Window 3      654.50 - 663
  • Rising Window 4      688.7 - 693.55


AXIS BANK LTD [ 17-Jan- 2014 ]


  • Axis Bank is trading under its 25 & 50 day Moving Average which depicts that & Short Term & Intermediate trend is weak
  • However Stock is trying to take support at  1156.65, which is the  50%  retracement  of its previous Downfall from 1549- 763, thereby a bounce to 1200 is likely to relieve oversold situation.
  • RSI on daily chart are still negatively poised.
  • Volume is irregular.
  • Further support is at 1133, 1108.
  • Resistance 1200, 1227.


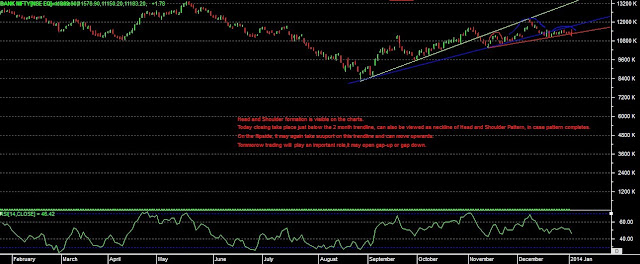
Bank NIfty- WEEKLY CHART ( Candles Record Session Lows )


  • A sharp decline commenced with Bearish Engulfing , that dragged the Banknifty down by 38% from its high within 3 months.
  • The consecutive  series of Red Candles shows the ill health of  Banknifty.
  • A spinning Top & hammer pattern occured at 11 & 12 low count record session, as a result a reversal was expected.
  • RSI indicator was also under oversold zone( under 30).

Thursday, January 16, 2014

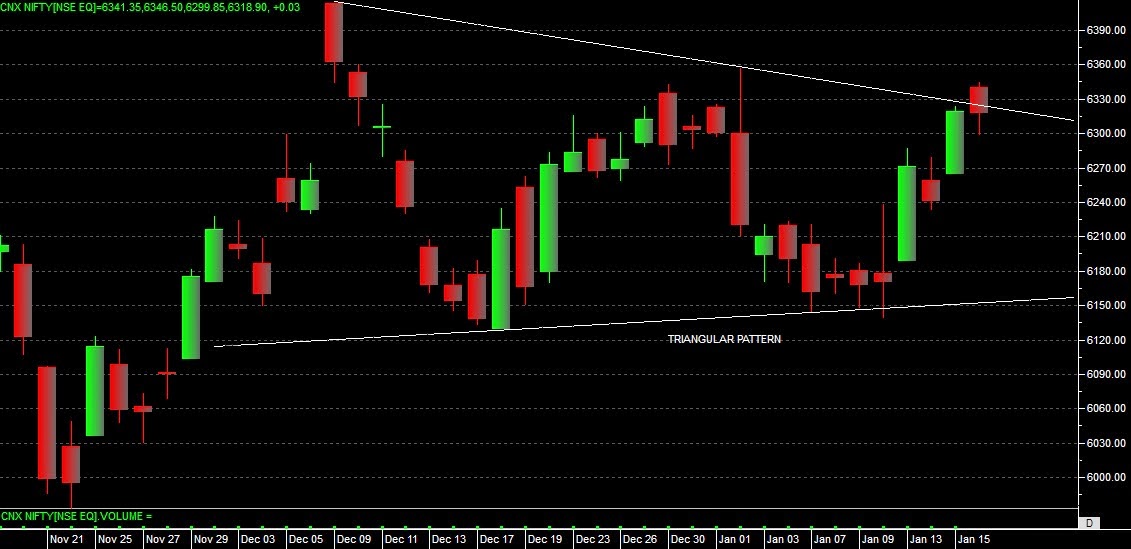
Triangular Pattern in nifty daily chart [16-Jan-2014]


  • Nifty opened above the upper line of Triangle Pattern, but unable to close above it, hence the breakout is not yet made.
  • Nifty closed with in & under the upper trendline of the Triangle Pattern.
  • Likely to test its immediate support at 6300, 6284.


DLF Candle Patterns [16-Jan-2014]


Resistance  162.85, 165.19, 167, 169 , 172

Support  160, 158.8, 157, 156.60, 149, 148

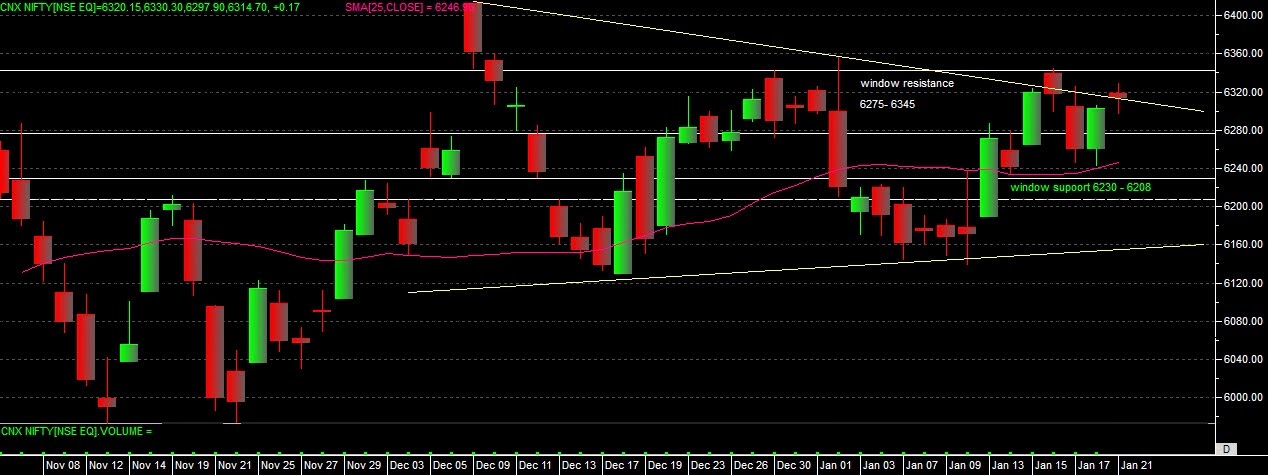
NIFTY CANDLE'S SUPPORT & RESISTANCE ZONES [ 16 Jan- 2014 ]


Resistance 6300, 6326, 6345


Support, 6300, 6275, 6250, 6230, 6200

Friday, January 10, 2014

SBIN Daily chart revisted ( 10-Jan-2014)

In furtherance to the analysis made on 3rd Jan, 2014 [http://techincallearning.blogspot.in/2014/01/sbin-3-01-2014.html]


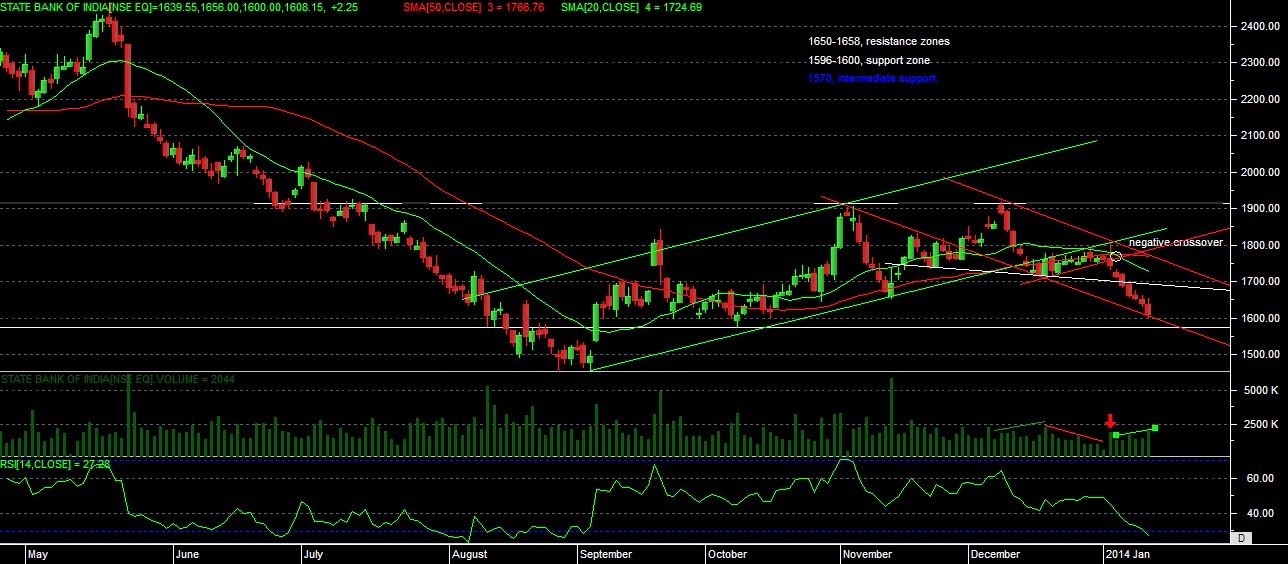
  • SBI  has been trading in a Down trending channel within a Rectangle Pattern.
  • Within a down trending channel , a flag pattern is seen, which takes place exactly in the middle of the Rectangle Pattern.
  • There was a sharp decline from upper line of the Rectangle pattern, with increasing activity in volume.
  • Consolidation of the flag takes place under the up-trending line, for 11 days, with diminishing volume.
  • A breakdown from flag lower trend line takes place with a black candle, with increasing activity in volume,  along with negative crossover( 20 day S.M.A crosses from above 50 day S.M.A) of Simple Moving Averages, which further confirms the aggressiveness of bears to take the move down.
  • Stock has intermediate support at 1596- 1600( Psychological level & lower line of downtrending channel).
  • Further Support is at 1570.
  • Resistance, 1644, 50, 58

Nifty Daily Charts[ 10-Jan-2014]


Nifty has been trading in a small range of 6140-6225 [ congestion, consolidation] for last 6 days.

Congestion band

  • In the First two days nifty was testing its 44 day EMA,( 6184), and broke it down on 3rd day and closed under it.
  • 4th, 5th day nifty traded with very small real red bodies and tested it 44 day EMA, in intra-day& sift through it , however closing came under it.
  • Today a bounce came in(which is expected also as nifty was testing it resistance at 6184), but supply overwhelm demand, however nifty tested its 20 day S.M.A and closed again under 44 day E.M.A.
  • Nifty has made a strong base at 6140.
  • Nifty is also having a strong support at 6130{ Previous bullish engulfing}
  • Resistance 6263, 6284, 6300.

Friday, January 3, 2014

SBIN [ 3-01-2014]


  • Stock has  made an Ascending Triangle Pattern on the daily charts , however stock has been trading in the compact range of the triangle for long toward the apex , which led the formation to see with suspicion and caution, and eventually the demand line of the triangle had broken on 11th December, 2013.
  • Since then stock has taken resistance on 25 day S.M.A.
  • Hence , now we can say Stock has been trading in the range of 300 points[ 1600-1900] from the past four months, which can be referred as rectangle and should be treated as such.
  • Within the Triangle a Head and Shoulder pattern is visible, however the neckline is not as yet broken.
  • Stock may touch the lower line of the Rectangle Pattern, or possibility of breakdown through it cannot be discarded, however on the flip side, if able to give closing above 25 day EMA in the near term, stock may test 200 S.M.A.
  • Support 1675, 1650, 1600.

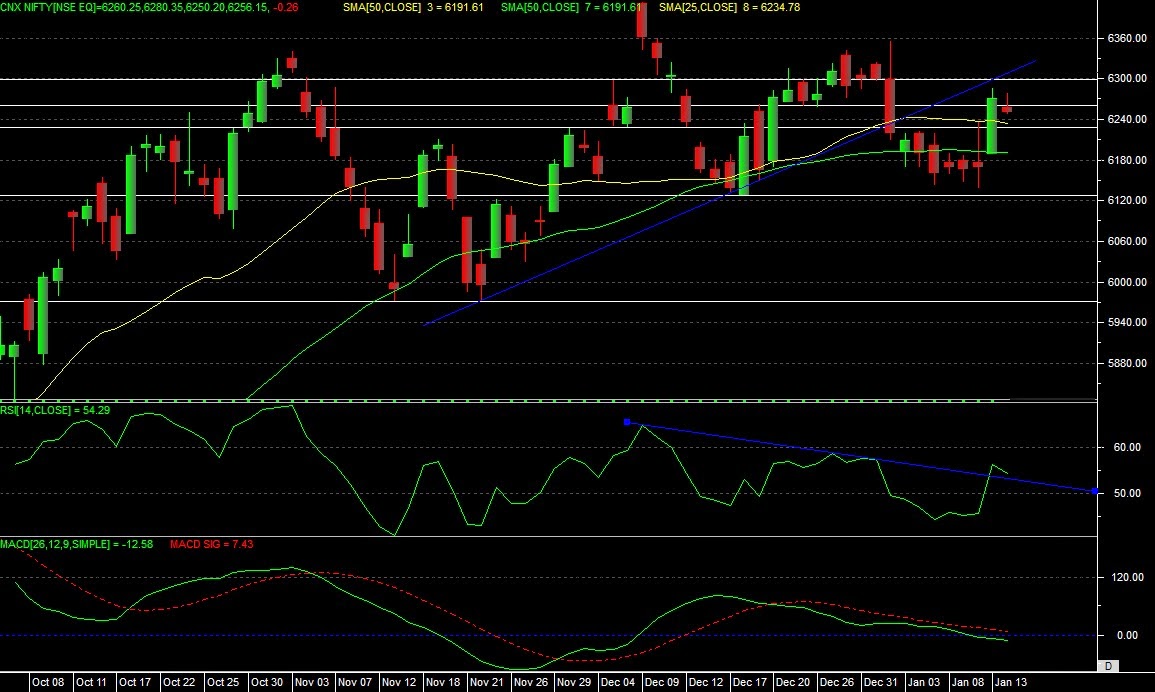
Nifty Daily Chart [ 3-01-2014


  • Head and Shoulder[H&S] Pattern is Visible on the daily charts of Nifty.
  • Today Gap down opening takes place , under the trend line,  which can be viewed as breakdown from H&S neckline.
  • However nifty has been trying to take support at 6185, failing which nifty may fall to 5900.
  • Immediate support is at 6185, 6170, 6150, 6130, 6100, 6088, 6040, 5972.
  • The Immediate trend line can now act as minor resistance in the short term, 
  • Resistance , 6222, 6260, 6300.