
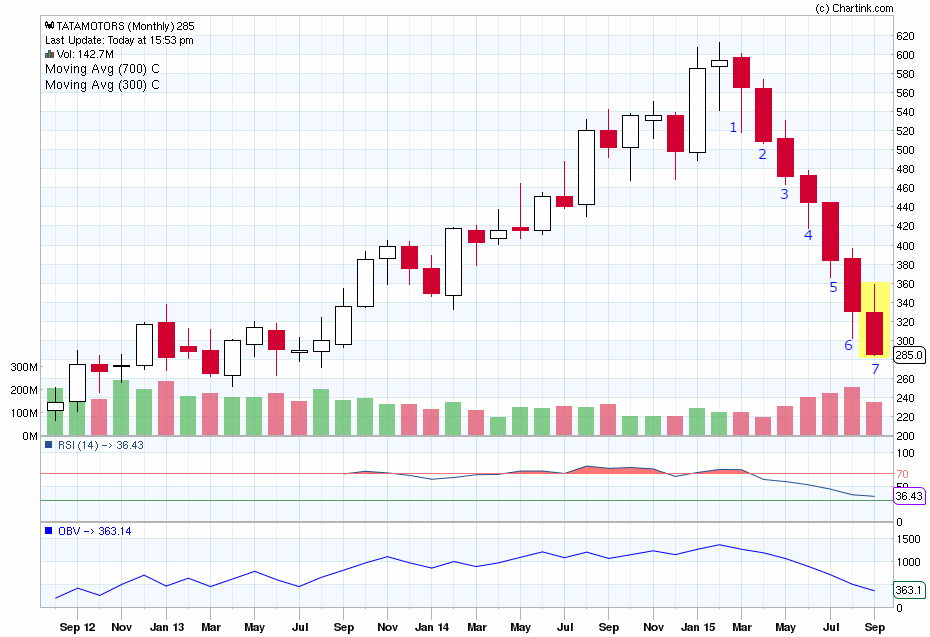
Tata motors registered a historic high of 612.45 in February 2015.

This high was made via large spinning top candle on monthly charts having long lower and upper shadows, followed by a bearish hanging man candle in march 2015, which unable to make another new high and closed below the February candle closing, indicated weakness has creeps in the stock.
If we observe monthly charts, we will see every monthly candle thereon is making lower high and lower low formation and as yet stock had registered 7 continuous lower high, lower low candles on monthly charts.

From all time Highs, the stock has eroded approx 53.2% of its value.
The stock even saw this month a breakdown from a long term up sloping trend line connecting lows of Feb 09 and Sep 11.
And now on also, we do not see any signs of reversals on the charts.
However, the stock has a cluster of supports coming by:
Monthly supports: 274- 264, 249-236.
Monthly resistance: 317, 374-388.
Weekly Support: 290-292.
Weekly Resistance: 325-330.
_________________________________________________________________________________
Let us move to the daily chart:

Recent daily structure suggested bullish shark probability on daily charts, however, prz of which is violated in today's session by a long bearish candle, which almost closed near its low , indicating further weakness is also possible in the coming sessions also.
NOW, If prz area of the said bullish shark acted as resistance, then we could see stock unfolding to the levels of 266-64.

This high was made via large spinning top candle on monthly charts having long lower and upper shadows, followed by a bearish hanging man candle in march 2015, which unable to make another new high and closed below the February candle closing, indicated weakness has creeps in the stock.
If we observe monthly charts, we will see every monthly candle thereon is making lower high and lower low formation and as yet stock had registered 7 continuous lower high, lower low candles on monthly charts.
From all time Highs, the stock has eroded approx 53.2% of its value.
The stock even saw this month a breakdown from a long term up sloping trend line connecting lows of Feb 09 and Sep 11.
And now on also, we do not see any signs of reversals on the charts.
However, the stock has a cluster of supports coming by:
Monthly supports: 274- 264, 249-236.
Monthly resistance: 317, 374-388.
Weekly Support: 290-292.
Weekly Resistance: 325-330.
_________________________________________________________________________________
Let us move to the daily chart:

Recent daily structure suggested bullish shark probability on daily charts, however, prz of which is violated in today's session by a long bearish candle, which almost closed near its low , indicating further weakness is also possible in the coming sessions also.
NOW, If prz area of the said bullish shark acted as resistance, then we could see stock unfolding to the levels of 266-64.
No comments:
Post a Comment